This morning, I was looking up old USGS quads for a few areas around Peoria, tracking some of the landscape changes over the past 120 years since the Geological Survey produced their first maps of the area. I always enjoy examining older maps and images of places, seeing how the built and natural environment transform over time. As a historian, using these images is probably my favorite way to investigate the past, and I can get lost in them for hours.
Finding such great stuff for Peoria – and procrastinating a bit – I decided to take a look at maps of Annapolis. And, as I proceeded down that rabbit hole, I thought that others might find these nautical charts, Sanborn insurance maps, and other images of Annapolis through the years interesting as well. These various maps and charts show how the Severn River and Spa (spelled Spaw in at least one of the old charts) Creek coastlines and the city and its waterfront has transformed, along with giving some sense of the changing way mapmakers and everyday Americans used and thought about their environment. I hope you enjoy these even half as much as I do.
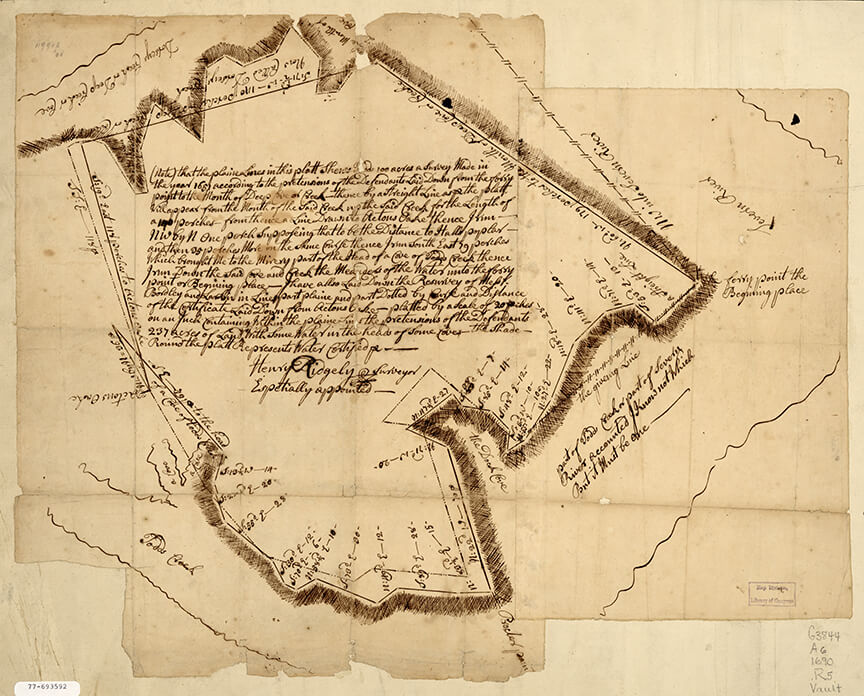
1690 Survey of Annapolis by Henry Ridgely, from the Library of Congress
From the Library of Congress collection, the above 1690 survey was the oldest image of Annapolis that I found this morning. In the close-up below, you can see that what is now Ego Alley is referred to as “The Dock Cove.” Todd’s Creek, apparently named for Thomas Todd, who was the first person to survey the area in 1651, refers to Spa Creek. And there is a “Procter’s Point,” which references Robert Proctor, one of the earlier inhabitants of the area and namesake for one of Annapolis’s first monikers, Proctor Landing.
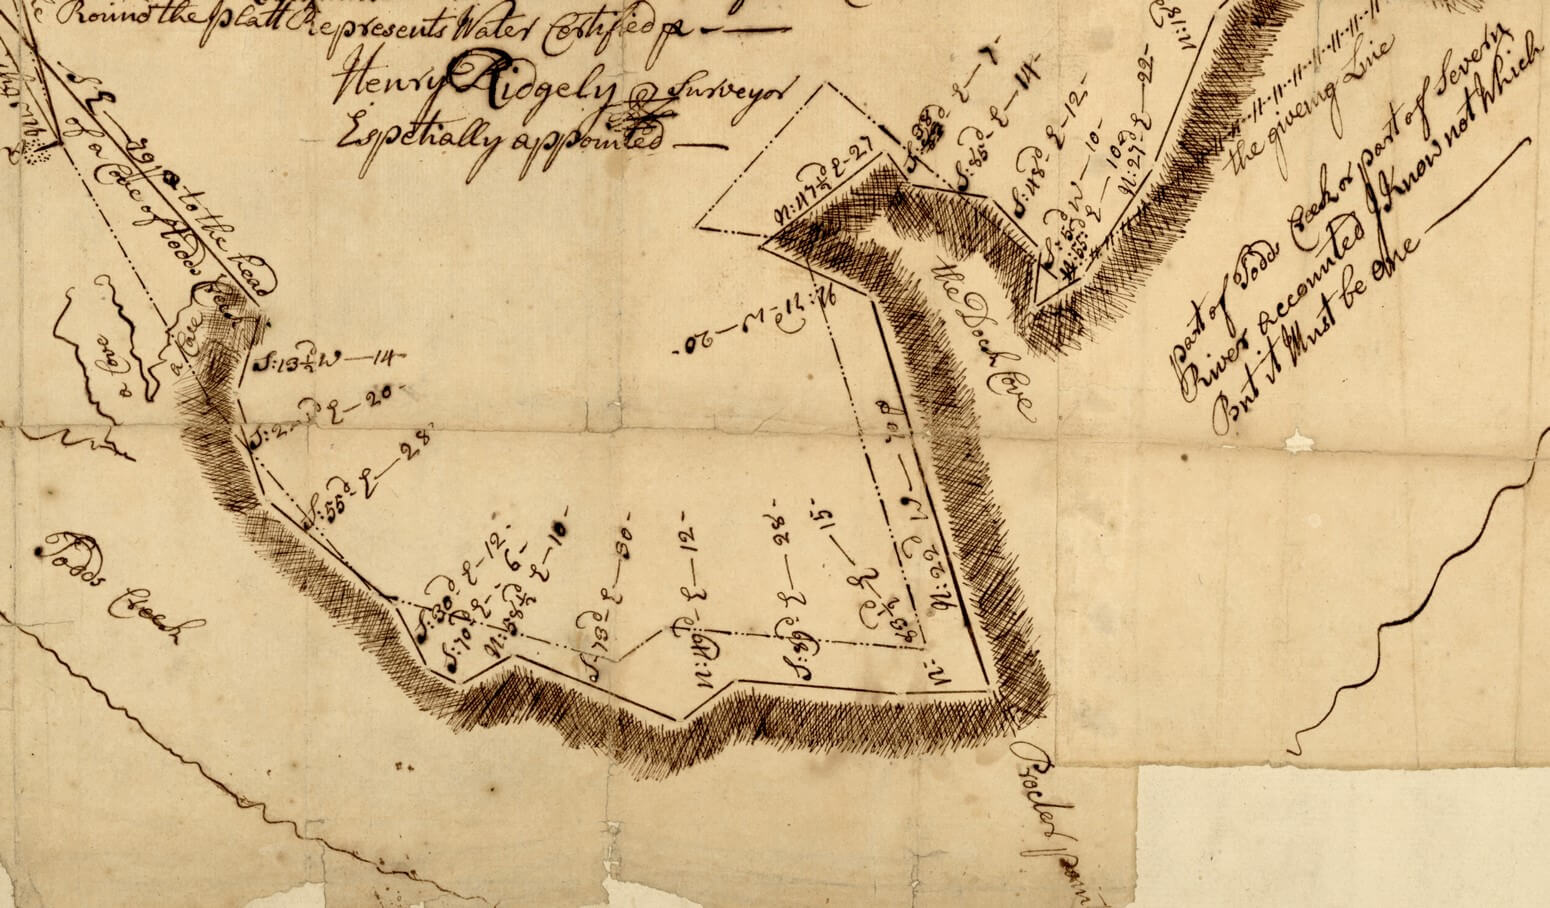
Close-up from the 1690 survey
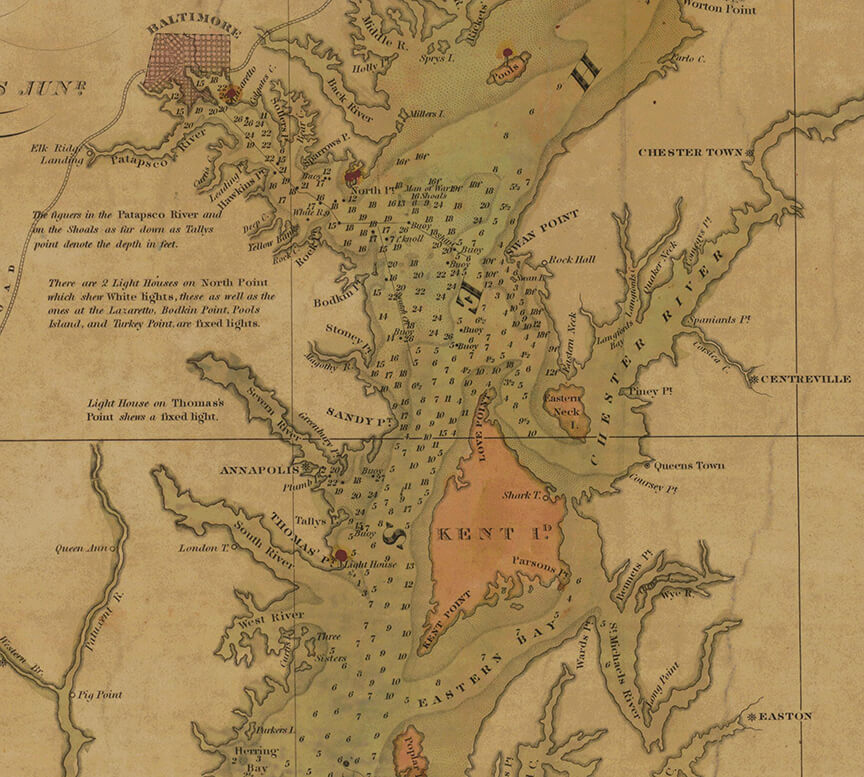
From and 1840 survey by Fielding Lucas, Jr., in the Office of Coast Survey’s Historical Map and Chart Collection
Skipping ahead quite a bit chronologically, I cropped the above image from what appears to be a private survey of the Chesapeake Bay. Fielding Lucas, Jr., who drafted the chart, was a Baltimore-based cartographer and publisher. Lucas’s chart came out just a few years before the federal Coast Survey began to chart the Chesapeake in 1843.
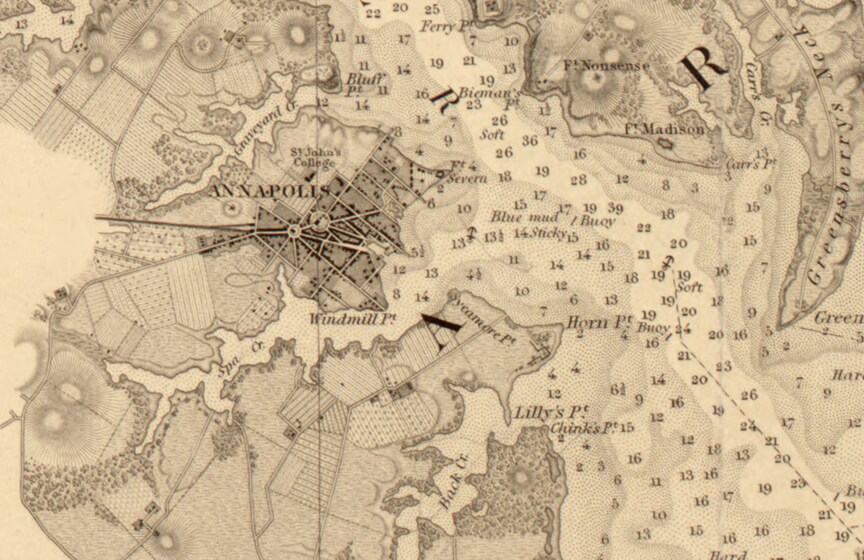
Close-up of Annapolis from the Office of Coast Survey’s 1846 Harbor of Annapolis chart, from the Library of Congress
In 1846, the Office of Coast Survey published a Harbor of Annapolis chart, which, I believe, was one of the early fruits of their vast efforts to chart the American coast. In 1807, Thomas Jefferson signed a bill into law that established the Coast Survey, but, aside from charting most of New York Harbor, they did not get underway in earnest until the 1830s because of various political conflicts.
Although the image above is a bit blurry at this magnification, I love the detail on the soundings and countryside surrounding Annapolis. I can almost picture ghosting past the town and up Spa Creek in a catboat, seeing those fields spread out along the waterside.
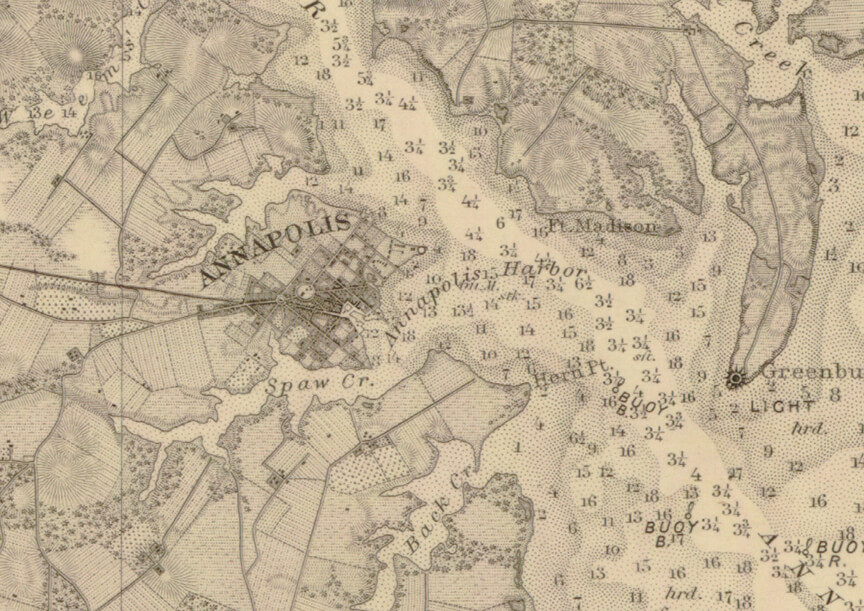
From the Coast Survey’s 1862 “Chesapeake Bay from Its Head to Potomac River,” from the Office of Coast Survey Historical Map and Chart Collection
The Coast Survey labored on the Chesapeake throughout the 1840s and 1850s, before preparations for the Civil War speeded them to finish their first complete chart of the Bay in 1862. The entire chart, like the cropped section above, is beautiful, filled with so much interesting information, providing a view into the Chesapeake in the mid-nineteenth century. You can view the whole chart yourself by clicking on the link above, but I warn you that you may end up spending an hour or two taking it all in.
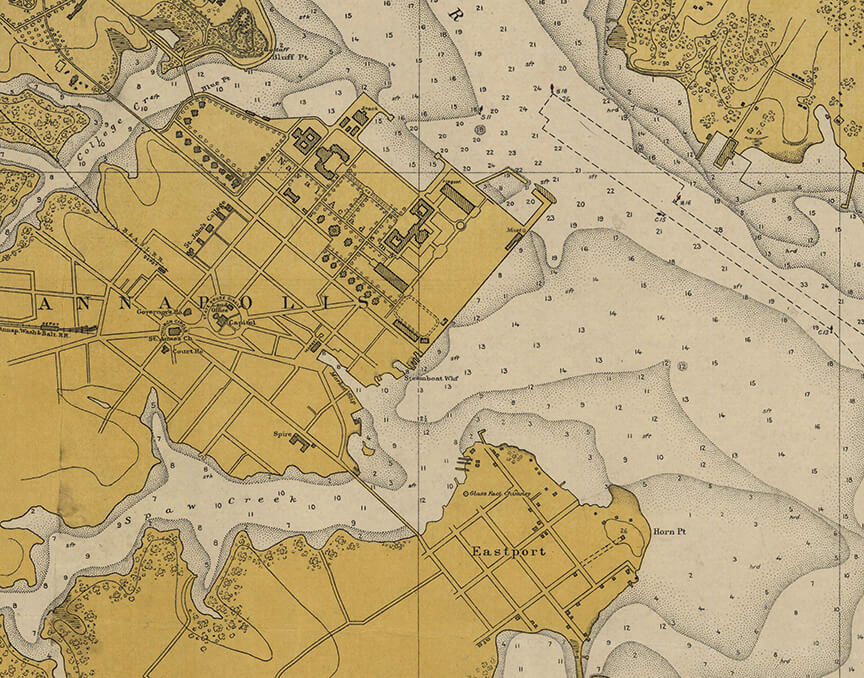
From the US Coast and Geodetic Survey’s 1911 Annapolis Harbor chart, from the Office of Coast Survey Historical Map and Chart Collection
In 1878 the Coast Survey was renamed the Coast and Geodetic Survey just as advances in technology allowed them to make ever more accurate charts. However, as you can see above in this 1911 chart, these later charts also lost some of their artistry, making the maps a little less romantic and evocative. What emerges in these turn-of-the-century efforts, though, is many of the depths and contours that we see on our charts today, mainly because vast stretches of the bottom have not been resurveyed since then.
I will turn away from the nautical charts now and give you a few sections of Sanborn maps showing the waterfront of Annapolis. The Sanborn maps are a boon for historians, as they were made for insurance purposes and therefore contained a tremendous amount of information about the built environment. I won’t go into the fascinating history of the Sanborn maps and how they have been used, but there is a great article on the topic here if you are interested in learning more.
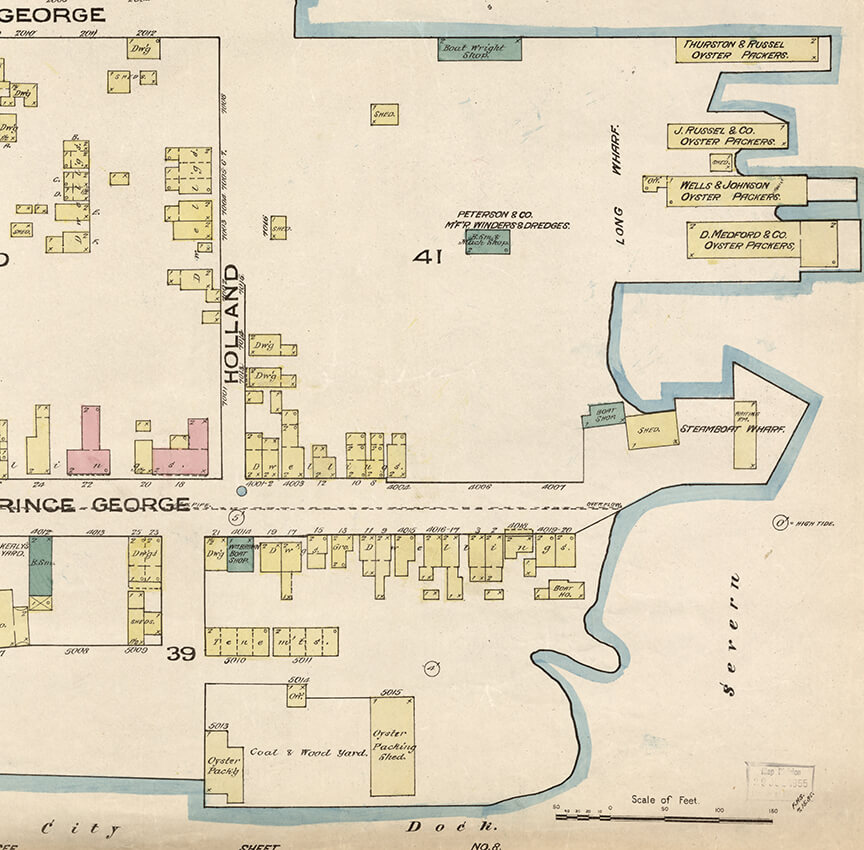
From the 1885 Sanborn map of Annapolis, from the Library of Congress
In the image above, you can see some of the businesses and buildings that lined the Annapolis waterfront in 1885. The area labeled “City Dock” is Ego Alley, feeding out into the mislabeled Spa Creek. I lose myself in time poring over these Sanborn maps, practically walking the streets in my mind’s eye.
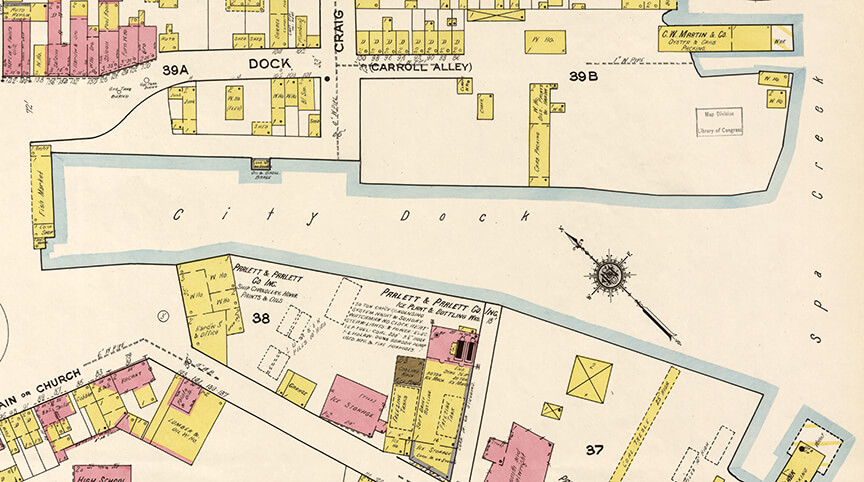
From the 1921 Sanborn map of Annapolis, from the Library of Congress
The above image is a section of the 1921 Sanborn map, showing Ego Alley. At least the site of Pusser’s had enough ice to make some rum drinks, even if they were only bottling soft drinks.
If you are interested in looking at more charts, maps, and images from other locations around the country, you can comb through the two databases that I used to find the materials above. The first is the Library of Congress’s American Memory site, which is an absolutely amazing compilation of some of the digitized highlights of their collection. I especially enjoy their Sanborn and Panoramic maps collections, though there is all sorts of stuff, including thousands of documents. The second is the Office of Coast Survey Historical Map & Chart Collection, which includes so many – maybe even all? – their old charts and even some, like the Lucas chart above, that they themselves did not produce.